
Does Windows 11 Show CPU Temperature? (Not Where You Think)
Learning how to check CPU temp Windows 11 isn’t as straightforward as you’d expect. When I first wanted to check my CPU temperature on Windows 11 I did what most people do.
I opened Task Manager clicked on the Performance tab, and expected to see my CPU temp right there next to the usage graphs. I was wrong
This confused me and it probably confuses you too. Task Manager shows your GPU temperature clearly in the Performance section. You can see it updating in real time when you select GPU from the hardware list. Naturally, I assumed my CPU temperature would be right there when I clicked on CPU. It wasn’t.
Task Manager only shows CPU utilization percentage, speed in GHz, and how many cores are active. It does not show CPU temperature at all. This surprised me because it seems so basic. If Windows 11 can display GPU temperature, why not CPU temperature?
I later found out this is a common point of confusion. Many users expect CPU temp to appear in Task Manager simply because GPU temp does.
Microsoft’s official documentation explains that Windows performance monitoring focuses on system utilization metrics rather than hardware temperatures.
According to Microsoft’s Performance Monitoring guidelines, Task Manager prioritizes showing CPU usage, memory consumption, and disk activity because these directly impact system performance. Temperature monitoring requires direct hardware sensor access, which explains why CPU temps don’t appear in Task Manager like GPU temperatures do.
The reality is that if you want to know how to check CPU temp Windows 11 properly, you need to use either your BIOS settings or install third-party software
Quick Reality Check:
✓ Task Manager shows GPU temp
✗ Task Manager does NOT show CPU temp
To actually check cpu temp in Task Manager is impossible. You will need a different method, which I will walk you through in the sections below.
What Task Manager DOES Show (vs What It Doesn’t)
Let me break down exactly what you can and cannot see in Windows 11 Task Manager when it comes to temperature monitoring.
What Task Manager DOES Show:
What Task Manager DOES Show:
• CPU utilization percentage
• CPU speed in GHz
• Active cores and logical processors
• CPU performance graphs over time
• GPU temperature (when you select GPU)
This means Task Manager is great for checking cpu performance in Windows 11, but completely useless for monitoring heat. If your PC is running hot or you are worried about overheating, Task Manager will not help you.
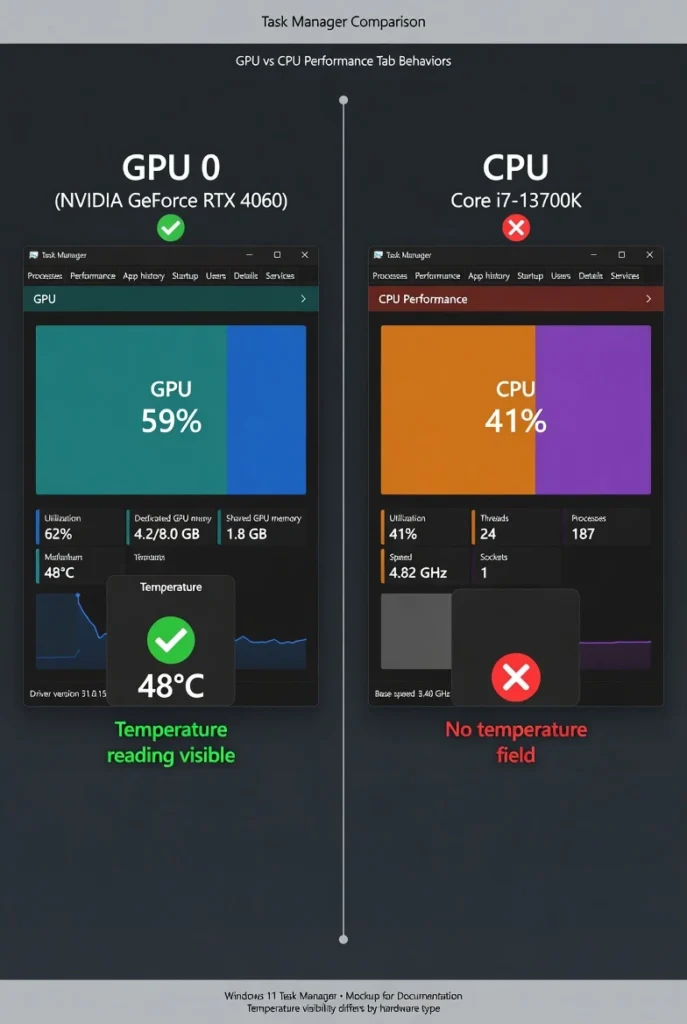
CPU temperature reading (right) a common source of
confusion.
What Are Normal CPU Temperatures in Windows 11?
I’ve learned that normal CPU temp in Windows 11 ranges from 30 to 50 degrees Celsius when your computer is idle, and up to 85 degrees Celsius during heavy tasks like gaming or video editing. Anything above 90 degrees Celsius puts your processor at risk of damage
I learned this the hard way when I first started monitoring my CPU temperature. I panicked when I saw my processor hitting 53 degrees Celsius during normal web browsing, thinking something was wrong. Turns out that was completely normal for a computer under light load.
Understanding what constitutes a safe cpu temperature range helps you know when to worry and when to relax. Most modern processors can handle brief spikes to higher temperatures, but sustained heat above 85 degrees Celsius triggers cpu thermal throttling, where your CPU slows itself down to prevent damage.
The key is knowing your baseline. When your computer is idle with no programs running, processor temperature should sit comfortably between 30 and 50 degrees Celsius. During everyday tasks like browsing or office work, temperatures between 50 and 65 degrees Celsius are perfectly normal.
Gaming and intensive work push temperatures higher, and that is expected. CPU temperatures between 70 and 85 degrees Celsius during heavy loads are acceptable and nothing to worry about.
CPU Temperature Ranges at a Glance
Here are the temperature ranges I use to judge whether my CPU is running safely:
| Computer State | Temperature (°C) | Temperature (°F) | Status |
|---|---|---|---|
| Idle (no apps open) | 30–50°C | 86–122°F | Normal ✓ |
| Light use (browsing) | 50–65°C | 122–149°F | Normal ✓ |
| Gaming/rendering | 70–85°C | 158–185°F | Acceptable ✓ |
| Thermal throttling | 85–95°C | 185–203°F | Warning ⚠ |
| Danger zone | 95°C+ | 203°F+ | Critical ✗ |
When temperatures reach 85 degrees Celsius or higher your CPU begins thermal throttling to protect itself. This means performance drops as the processor reduces its speed to generate less heat.
Temperatures above 95 degrees Celsius put your CPU in the danger zone where permanent damage becomes possible.
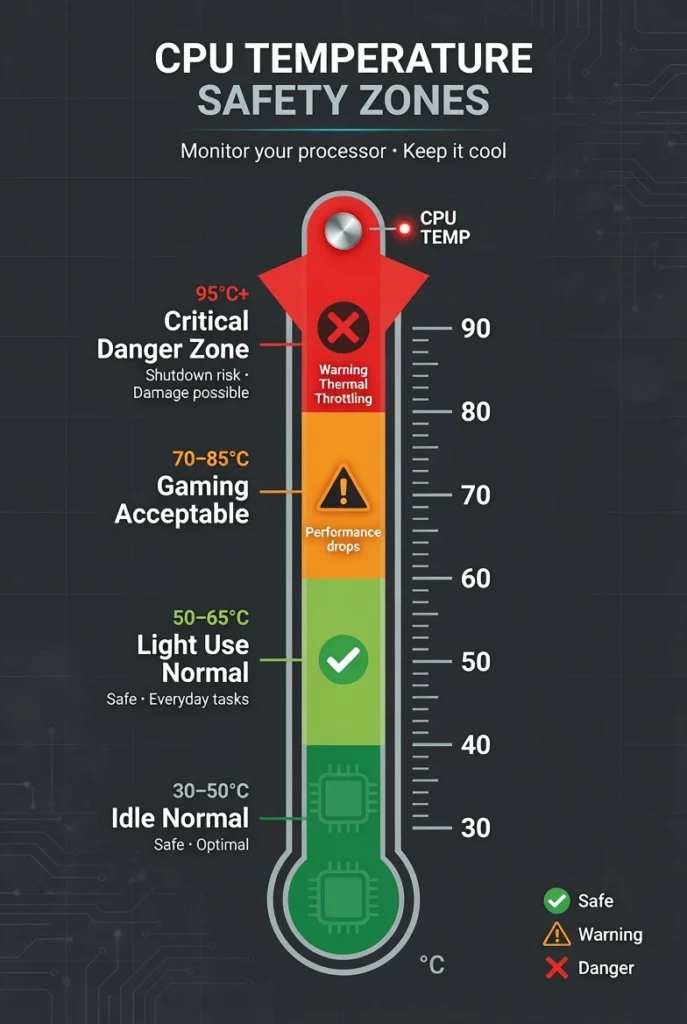
temperatures above 95°C risk permanent CPU damage.
Do AMD and Intel CPUs Run at Different Temperatures?
AMD and Intel processors do have slightly different temperature patterns, though both share similar danger zones around 95 degrees Celsius.
AMD CPU temperature tends to run warmer at idle, typically sitting between 35 and 50 degrees Celsius even when doing nothing. This happens because AMD Ryzen processors use an aggressive boost algorithm that briefly spikes performance and temperature even during light tasks.
Intel CPU temperature usually idles cooler, staying between 30 and 45 degrees Celsius when the computer is not working hard. Intel processors tend to have more predictable temperature curves that rise steadily with workload.
Both processor types can safely handle the same maximum temperatures during heavy work. The real difference is in their idle behavior, not their performance limits.
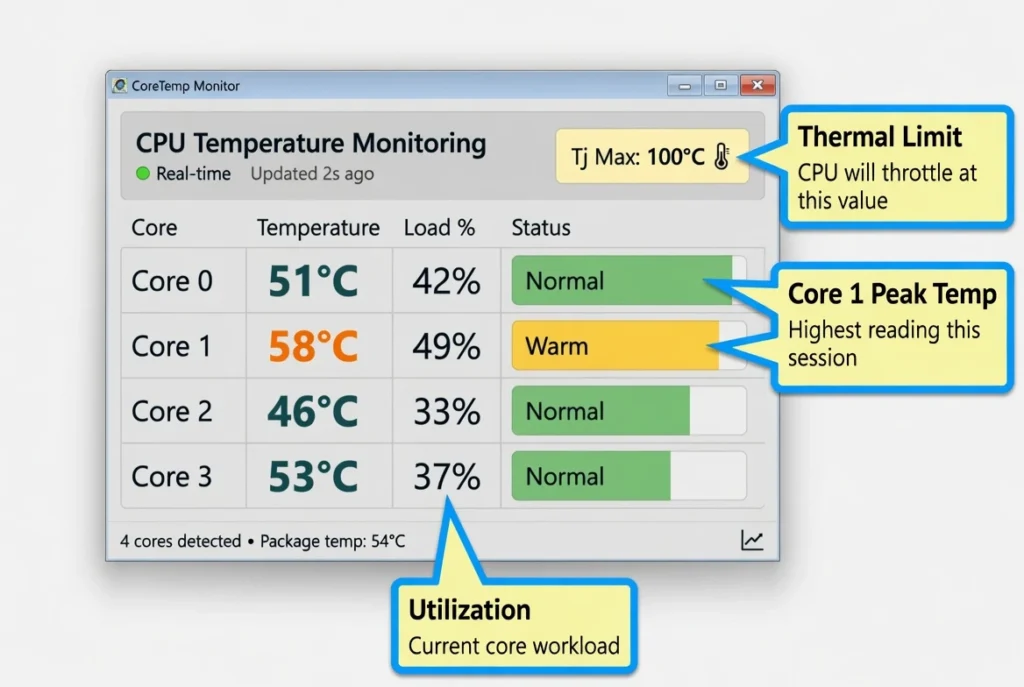
To find your specific CPU’s maximum safe temperature, use software like Core Temp which shows the Tj Max value for your exact processor model. This tells you the precise thermal limit your CPU can handle before shutting down to prevent damage.
Signs Your CPU Is Overheating Before You Even Check
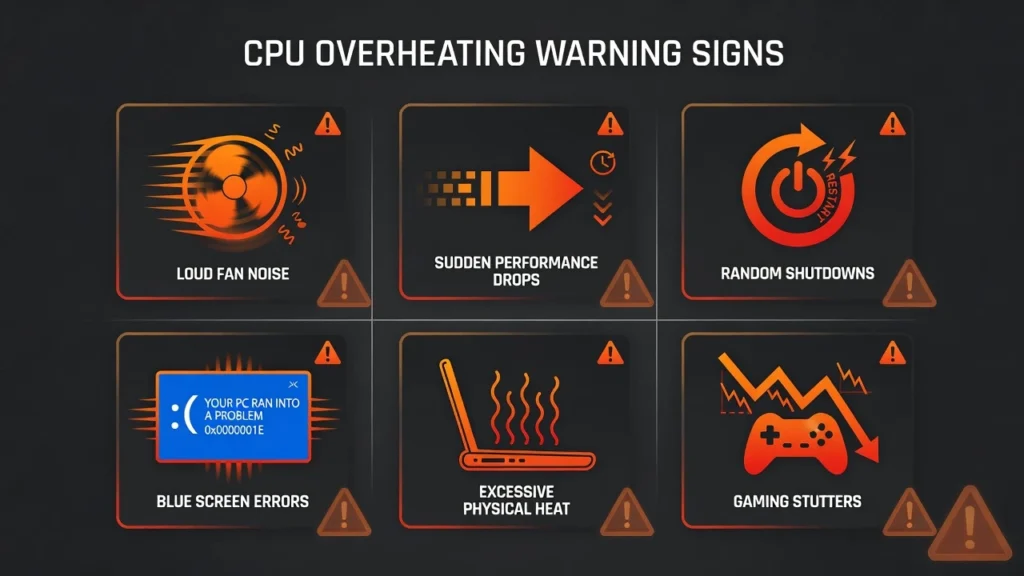
CPU overheating symptoms include sudden computer slowdowns, loud fan noise that never stops, random restarts, and the Blue Screen of Death appearing during normal use. These warning signs mean your CPU temperature is too high and needs immediate attention.
I have seen these symptoms firsthand when helping friends with overheating computers. The most obvious sign is when your computer fans start running at full speed constantly, making your laptop or desktop sound like a jet engine even during simple tasks like web browsing.
Performance problems are usually the first thing you notice. Your computer suddenly becomes sluggish when opening programs or switching between windows. Sometimes you will see Task Manager showing 100% CPU usage in the Performance tab even when you are not running demanding software.
The more serious symptoms include random restarts where your computer just shuts off without warning, especially during gaming or video calls. Blue Screen of Death errors become frequent, and your computer might freeze completely requiring a hard restart.
may already be too high — check it now.
For laptop users, the most immediate sign is physical heat. If your laptop feels uncomfortably hot to touch, especially around the keyboard or bottom panel, that usually means internal temperatures are too high. Extreme overheating can even cause display problems like green screen issues or other visual artifacts that require immediate attention
Gaming becomes impossible when overheating occurs because cpu thermal throttling kicks in. Your processor automatically slows down to prevent damage, causing frame rate drops and stuttering that makes games unplayable.
When you notice any of these symptoms, stop using demanding programs immediately and check your CPU temperature using the methods I will show you next. Continuing to use an overheating computer risks permanent hardware damage.
- Press Windows key + I to open Settings
- Click System in the left sidebar, then scroll down to Recovery
- Next to Advanced startup, click “Restart now”
- Your computer will restart to a blue screen with options
- Select Troubleshoot, then Advanced options
- Click “UEFI Firmware Settings” and then Restart.
Method 1 — Check CPU Temp Without Installing Anything (BIOS/UEFI)
You can check CPU temperature without downloading any software by accessing your computer’s BIOS or UEFI firmware settings. This method shows processor temperature directly from your motherboard’s hardware sensors, though it only displays idle temperatures since Windows isn’t running.
Here’s how to access BIOS temperature readings on Windows 11:
- Press Windows key + I to open Settings
- Click System in the left sidebar, then scroll down to Recovery
- Next to Advanced startup, click “Restart now”
- Your computer will restart to a blue screen with options
- Select Troubleshoot, then Advanced options
- Click “UEFI Firmware Settings” and then Restart
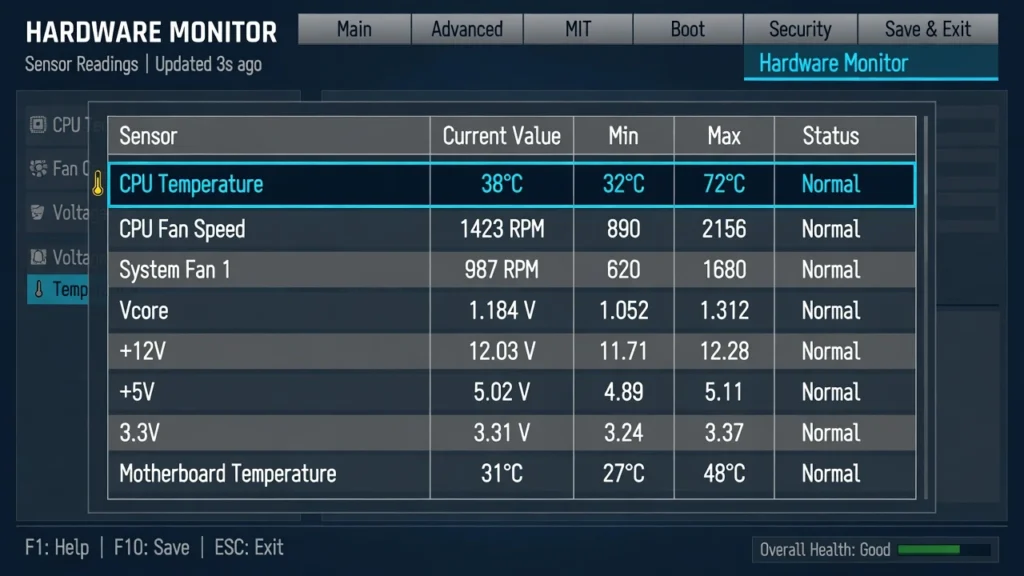
your BIOS to find the CPU temperature sensor reading.
Once in BIOS, look for sections labeled Hardware Monitor, PC Health Status, or H/W Monitor to find your CPU temperature reading.
Method 2 — Check CPU Temp Using CMD (No Download Needed)
You can check CPU temperature using Command Prompt on Windows 11 without downloading any software, but this method only works if your motherboard supports WMI temperature reporting. Unlike BIOS/UEFI access, the CMD method runs while Windows is active and shows temperature during normal use.
I find this approach useful because it requires no downloads and works from within Windows 11. However, I need to be honest about its limitations. Many motherboards do not expose processor temperature data through Windows Management Instrumentation, which means the script either shows zero degrees or completely wrong readings.
The method uses a Windows command called WMIC that queries your system’s thermal sensors. When it works, you get accurate real-time CPU temperature readings. When it does not work, you might see impossibly low temperatures like 10 degrees Celsius even when your laptop is running hot.
You must run the command as administrator for it to access hardware sensor data. Some users report success on desktop computers with newer motherboards, while others get incorrect readings especially on laptops.
The CMD Temperature Script
Here is the complete working script that queries CPU temperature through Windows 11:
text@echo off for /f “skip=1 tokens=2 delims==” %%A in (‘wmic /namespace:\root\wmi PATH MSAcpi_ThermalZoneTemperature get CurrentTemperature /value’) do set /a “HunDegCel=(%%~A*10)-27315” echo %HunDegCel:0,-2%.%HunDegCel:-2% Degrees Celsius pauseTo use this script, open Notepad and paste the code above. Save the file as “gettemp.cmd” on your desktop. Right-click the file and select “Run as administrator.” The command window will display your CPU temperature in Celsius if your motherboard supports WMI thermal reporting.
The script converts raw thermal data from decikelvin to Celsius using a mathematical formula, which explains the complex calculation in the code.
Why CMD Might Show the Wrong Temperature
CMD temperature readings depend entirely on your motherboard exposing thermal zone data through Windows Management Instrumentation. If your motherboard manufacturer did not include this feature, the script will return zero degrees or unrealistic low temperatures.
I have seen cases where the script shows 10 degrees Celsius on a laptop that is clearly overheating. This happens because the WMI thermal zone either does not exist or reports incorrect sensor data.
If CMD shows obviously wrong processor temperature readings, skip this method and use the software-based approaches in the next sections for accurate temperature monitoring.
Method 3 — Core Temp: The Simplest Software for Beginners
Core Temp is the most beginner-friendly CPU temp monitor software because it shows only essential information without overwhelming you with unnecessary details. The Core Temp application displays individual core temperatures, maximum safe limits for your specific processor, and current load percentages in a simple, easy-to-read interface.
I recommend Core Temp for first-time users because the software requires zero configuration and starts monitoring immediately after installation. Unlike complex monitoring suites that show dozens of sensors, Core Temp focuses exclusively on processor temperature data that actually matters.
The download file is small at only a few megabytes, and the program uses minimal system resources while running. Core Temp works with both Intel and AMD processors and accurately reads thermal data from virtually every CPU made in the last decade.
However, you need to be careful during installation. The installer includes bundled software that tries to install automatically, which can be annoying if you are not expecting it. I will show you exactly how to avoid this issue and get a clean installation.
Many users in online discussions confirm that Core Temp works great for basic temperature monitoring. One user mentioned it helped them see how much their laptop cooling fan was actually helping with temperatures, which is exactly the kind of practical insight you want from monitoring software.
from Tj. Max, and current load — all in one compact
window.
How to Download Core Temp Without Getting Bundled Software
Here is the step-by-step process I use to install Core Temp cleanly without unwanted extras:
- Go to alcpu.com/CoreTemp and click the official download button
- Ignore any banner advertisements that look like download buttons
- Run the installer file from your downloads folder
- On the “Additional Tasks” screen, carefully uncheck “Install Goodgame Empire”
- This checkbox is preselected by default and hidden under the icons section, making it particularly sneaky
- Also uncheck additional language packs unless you need them
- Make sure “Create a desktop shortcut” stays checked for easy access
- Click Install and then Launch when installation completes
Power User Tip: Skip the installer entirely by opening Command Prompt and running winget install coretemp. This command-line installation bypasses all bundled software and gives you a completely clean Core Temp setup.
Reading Core Temp’s Display
Core Temp shows three key pieces of information for each processor core. “Core #0, Core #1” and so on display the current temperature of individual CPU cores in degrees Celsius. “Tj. Max” shows the maximum safe temperature limit for your specific CPU model, which varies between different processors.
The “Load %” number indicates how hard each core is currently working, from 0% idle to 100% maximum utilization. If any core temperature comes within 10 degrees of the Tj. Max value, you should take action to cool down your processor temperature.
For example, if Core Temp shows 53°C at 37% load, that represents normal operation for a computer doing light work. This gives you a baseline to compare against when running demanding software or games.
Method 4 — HWiNFO: Best for Detailed CPU Temperature Monitoring
HWiNFO provides the most comprehensive real-time CPU monitoring of any free third-party monitoring software, showing not just processor temperature but also GPU, RAM, storage, motherboard, and even WiFi module temperatures all in one interface. This makes HWiNFO the best choice when you need detailed system monitoring beyond basic CPU temp checking.
I use HWiNFO when I want to see everything happening inside my computer at once. Unlike Core Temp which focuses only on CPU data, HWiNFO cpu temperature monitoring comes alongside dozens of other sensors that help diagnose which component might be causing performance issues.
The software provides real-time, minimum, and maximum temperature readings for every sensor, so you can see not just current temperatures but also the highest and lowest readings since you started monitoring. This historical view helps identify temperature spikes you might miss with real-time monitoring alone.
HWiNFO works especially well on Windows 11 because it can verify that your system meets Windows 11 requirements by showing TPM 2.0 and Secure Boot status alongside temperature data. The software also displays your CPU architecture details, core and thread counts, and SSD health percentages.
Be careful when downloading HWiNFO because there may be advertisements on the site that look like download buttons. Make sure you select the correct installer option from the official download section to avoid unwanted software.
Navigating HWiNFO’s Sensor Window
HWiNFO’s sensor list contains hundreds of readings which can feel overwhelming at first, but finding CPU temperature data follows a simple pattern:
- Open HWiNFO and click Start to begin the system scan
- Click the “Sensors” button at the top left of the main window
- Scroll down past motherboard and chipset sensors
- Look for the section labeled “CPU [your processor name]”
- Find “CPU Package” temperature, which shows your overall processor temp
- Individual “Core #0, Core #1” readings show per-core temperatures
The CPU Package temperature is the most important reading because it represents your processor’s overall thermal state. Individual core temperatures help identify if specific cores are running hotter than others.
Enable logging to track temperature changes over time by going to File and selecting “Log All Sensors.” This creates historical charts that help identify temperature patterns during different activities.
HWiNFO Bonus: Check CPU and GPU Temperature Together
Unlike single-purpose monitoring tools, HWiNFO shows CPU Package temperature, GPU core temperature, RAM temperature, and storage temperatures simultaneously in one window. This comprehensive view helps you quickly identify which component is causing system slowdowns or overheating.
The GPU section displays graphics card temperature alongside CPU readings, making it easy to compare thermal performance between your processor and graphics card during gaming or intensive work. For Windows 11 users, scroll to the system summary section to verify that TPM 2.0 and Secure Boot are properly enabled.
HWiNFO also monitors SSD health percentages, showing drive condition alongside temperature data. I have seen drives with 98% health remaining, which indicates good storage condition alongside normal operating temperatures.
Method 5 — MSI Afterburner: Best Option If You Already Game on Your PC
MSI Afterburner works as dual-purpose CPU temp monitor software if you already use it for GPU overclocking and gaming performance monitoring. The main interface displays your CPU temperature alongside voltage, clock speed, and fan limits in one convenient location, making it ideal for gamers who want to check GPU and CPU temperature without running multiple programs.
I recommend this approach for PC gamers because MSI Afterburner likely already sits in your system tray monitoring graphics card performance. Adding CPU temperature monitoring requires just a few clicks in the settings menu, and you get real-time CPU monitoring without installing additional software.
The setup file is approximately 50 MB and downloads quickly from the official MSI website. During installation, make sure RivaTuner Statistics Server stays checked because this component enables the on-screen overlay features that many gamers use during gameplay.
MSI Afterburner provides Windows 11 temperature monitoring for both your processor and graphics card simultaneously, which helps identify whether CPU or GPU temperatures are causing performance issues during gaming sessions. The software shows current, minimum, and maximum temperatures for both components.
The system tray monitoring feature makes MSI Afterburner particularly useful for tracking CPU temp during normal computer use, not just gaming. Once configured, you can see processor temperature in your Windows system tray without opening the full application interface.
Setting Up CPU Temp in Your System Tray
Here is exactly how I configure MSI Afterburner to show CPU temperature in the Windows system tray:
- Open MSI Afterburner and click the gear icon to access Settings
- Navigate to the Monitoring tab in the settings window
- Scroll down the hardware list to find “CPU Temperature”
- Click on CPU Temperature and check both “Show in On-Screen Display” and “Show in tray icon”
- Click OK to save the settings
Your CPU temperature now appears permanently in the bottom-right system tray area. You can see current processor temperature at any time without opening the full MSI Afterburner interface.
For quick visual reference, customize the tray icon by changing the display from numerical temperature to a bar chart format, or change the tray icon color to make temperature readings more noticeable at a glance.
Method 6 — Other Free Tools Worth Knowing About (Speccy, HWMonitor, Open Hardware Monitor)
Beyond the main CPU temperature monitoring tools I have covered, three additional programs deserve mention because they each offer unique advantages for different types of users. Speccy, HWMonitor, and Open Hardware Monitor all provide reliable processor temperature readings with distinct approaches to system monitoring.
I mention these tools because many experienced users actually run multiple temperature monitoring programs simultaneously. One Reddit user mentioned using Open Hardware Monitor alongside two other tools, which shows that having backup options helps verify temperature accuracy across different software.
These three programs fill specific niches that the mainstream tools might not address. Speccy excels at providing quick system overviews for casual users, HWMonitor offers detailed sensor readings in a compact interface, and Open Hardware Monitor appeals to privacy-conscious users who prefer open-source third-party monitoring software.
Each tool handles Windows 11 temperature monitoring reliably, but the choice between them depends on your specific needs and preferences. Community discussions consistently mention all three as trustworthy alternatives, with users recommending different tools based on their experience levels and monitoring requirements.
Quick Comparison: Which Tool Should You Use?
Here is my recommendation for choosing the best CPU temp monitor Windows 11 tool based on your specific needs:
| Tool | Best For | Install Size | CPU + GPU? | Key Advantage |
|---|---|---|---|---|
| Core Temp | Beginners | Tiny | CPU only | Simplest interface |
| HWiNFO | Power users | Medium | Both | Most comprehensive |
| MSI Afterburner | Gamers | 50MB | Both | System tray integration |
| Speccy | Quick overview | Medium | Both | One-screen system summary |
| HWMonitor | Detailed sensors | Small | Both | Compact detailed readings |
| Open Hardware Monitor | Privacy-focused | Small | Both | Open-source transparency |
For most users, I recommend starting with Core Temp for basic CPU monitoring, then trying HWiNFO if you need more detailed system information. The Speccy temperature monitor works well for users who want a complete system overview including temperatures, while Open Hardware Monitor appeals to users who prefer open-source software they can trust completely.
Method 7 — How to See CPU Temp While Gaming (On-Screen Overlay)
You can track CPU temp while gaming by setting up an on-screen overlay that displays real-time CPU monitoring directly on your game screen without needing to alt-tab or pause gameplay. This method uses MSI Afterburner combined with RivaTuner Statistics Server to show processor temperature as text overlaid on any game.
I use this pro-level approach because it lets me check GPU and CPU temperature simultaneously during intensive gaming sessions. This is especially important if you’re using a gaming laptop where thermal management directly impacts performance. When temperatures spike above 85 degrees Celsius during gaming, I know immediately if CPU thermal throttling might affect my frame rates, and I can adjust game settings before performance drops
The on-screen overlay appears as small text in the corner of your game screen showing current CPU temperature, GPU temperature, frame rate, and other metrics you choose to monitor. This real-time data helps you understand how different games stress your system and whether your cooling solution handles the workload effectively.
During installation, ensure RivaTuner Statistics Server stays checked because this component handles the actual overlay display functionality. MSI Afterburner collects the temperature data, but RTSS puts that information on your screen during gameplay.
Some newer laptops and CPUs do not expose all sensor data directly to MSI Afterburner, which means CPU temperatures might not appear in the monitoring list. The solution involves integrating HWiNFO with Afterburner through a plugin system that brings additional sensor data into the overlay.
Setting Up the Gaming Overlay (Step-by-Step)
Here is exactly how I configure the on-screen temperature display for gaming:
- Download MSI Afterburner from the official MSI website
- During installation, make sure RivaTuner Statistics Server checkbox stays checked
- Open MSI Afterburner and click the Settings gear icon
- Navigate to the Monitoring tab in the settings window
- Click on “CPU Temperature” in the hardware list and check “Show in On-Screen Display”
- Select “CPU Package” instead of individual core temperatures for a cleaner overlay
- Open RivaTuner Statistics Server from your system tray and use the “On-Screen Display Zoom” slider to increase text size for better visibility
Launch any game and the CPU temperature overlay appears in the top-left corner of your screen, updating in real-time as you play.

in real time — no alt-tabbing required.
What If Your CPU Doesn’t Show in Afterburner?
Some newer processors and laptop systems do not expose complete sensor data to MSI Afterburner, which means CPU temperature might not appear in the monitoring options. The solution involves connecting HWiNFO temperature data to your Afterburner overlay.
Install HWiNFO and enable “Shared Memory Support” in the HWiNFO settings menu. Then, in MSI Afterburner’s Monitoring tab, click the three dots next to the hardware graphs and select the HWiNFO.dll plugin option. Click Setup, then Add to import HWiNFO sensors into Afterburner.
Find “CPU Package Temperature” from the HWiNFO sensor list and assign it the Group Name “CPU” to organize your overlay data. Now HWiNFO CPU temperature appears in your gaming overlay even when Afterburner cannot access the sensor directly.
How to See CPU Temp While Gaming (On-Screen Overlay)
Gaming while monitoring CPU temperature in real-time requires setting up an on-screen overlay that displays processor temperature directly over your game without interrupting gameplay. I accomplish this using MSI Afterburner paired with RivaTuner Statistics Server to create a temperature display that appears as text overlay during any gaming session.
This approach transformed how I monitor system performance during intense gaming. Instead of alt-tabbing out of games to check temperatures, I can see CPU temp while gaming right on my screen alongside frame rate and GPU temperature data.
The overlay shows up as small text in a corner of your game screen, updating continuously as your processor temperature changes. I find this especially valuable during long gaming sessions where CPU temperatures can gradually climb, potentially leading to thermal throttling that reduces performance.
MSI Afterburner handles the temperature data collection, while RivaTuner Statistics Server manages the actual overlay display functionality. Both programs must work together to create the on-screen temperature monitoring system.
Some newer processors and gaming laptops present compatibility challenges where CPU sensor data does not appear in MSI Afterburner’s monitoring options. I solve this by integrating HWiNFO sensor data through a plugin system that bridges the gap between different monitoring tools.
Setting Up Your Gaming Temperature Overlay
Creating an effective on-screen CPU temperature display requires following these specific configuration steps that I have tested across multiple gaming systems:
- Download MSI Afterburner from the official MSI gaming website
- During the installation process, ensure RivaTuner Statistics Server remains checked in the components list
- Launch MSI Afterburner and access Settings by clicking the gear icon
- Switch to the Monitoring tab within the settings interface
- Locate “CPU Temperature” in the available sensors list and click to select it
- Check the box labeled “Show in On-Screen Display” to enable overlay functionality
- Choose “CPU Package” rather than individual core readings for a cleaner display
- Launch RivaTuner Statistics Server from your system tray and adjust the “On-Screen Display Zoom” setting to make text readable during gameplay
Start any game and your CPU temperature overlay will appear in the designated screen corner, providing real-time processor temperature updates throughout your gaming experience.
Troubleshooting When CPU Temperature Does Not Appear
Modern gaming laptops and newer desktop processors sometimes restrict sensor access, preventing MSI Afterburner from detecting CPU temperature data directly. I encounter this limitation frequently with recent hardware and solve it using HWiNFO integration.
Install HWiNFO64 and navigate to its settings menu to enable “Shared Memory Support,” which allows other applications to access HWiNFO sensor readings. Return to MSI Afterburner’s Monitoring tab and click the three-dot menu button next to the sensor graphs.
Select “HWiNFO.dll plugin” from the available options and click Setup to configure the integration. Click Add to import available HWiNFO sensors into your MSI Afterburner monitoring list.
Search for “CPU Package Temperature” among the imported sensors and assign it a Group Name such as “CPU” to organize your overlay information logically. Your HWiNFO CPU temperature data now appears in gaming overlays even when direct sensor access fails.
Which Method Should You Use? (Quick Decision Guide)
Choosing the right CPU temperature monitor depends on your specific needs and technical comfort level. Here is my simple decision guide to help you pick the best method for checking CPU temp in Windows 11:
If you want no downloads: Use BIOS/UEFI method for basic idle temperature readings, or try the CMD script for real-time monitoring if your motherboard supports it.
If you are a complete beginner: Core Temp provides the simplest interface with just essential temperature information and minimal setup required.
If you want the most comprehensive data: HWiNFO shows every sensor in your system including CPU, GPU, RAM, and storage temperatures in one detailed interface.
If you are a PC gamer: MSI Afterburner with RivaTuner Statistics Server gives you on-screen overlay monitoring during gameplay alongside GPU performance data.
If you use a laptop: HWiNFO or Core Temp work reliably on most laptops, while BIOS access varies by manufacturer.
Remember that any good CPU temperature monitor should help you stay within the safe cpu temperature range we discussed earlier. Overheating can lead to various Windows 11 problems including system errors and crashes that affect your daily computing. Choose your method and check cpu temperature in Windows 11 right now. Your PC’s performance and longevity depend on keeping those temperatures under control.
Frequently Asked Questions
Why doesn’t Windows 11 show CPU temperature in Task Manager like it does for GPU?
I honestly don’t know why Microsoft made this choice. Task Manager shows GPU temperature clearly, but CPU temperature requires either BIOS access or third-party software. It seems like such a basic feature that should be built in, but it just isn’t there.
Is 70°C too hot for my CPU during gaming?
No, 70°C is perfectly normal for gaming. I consider anything under 85°C during heavy use to be safe. Your CPU won’t start thermal throttling until around 85-90°C, so you have plenty of headroom at 70 degrees.
The CMD temperature script shows 10°C but my laptop is really hot. What’s wrong?
Your motherboard doesn’t support WMI temperature reporting, so the script returns garbage data. This happens frequently on laptops. Skip the CMD method and use Core Temp or HWiNFO instead for accurate readings.
Is Core Temp safe to install? I heard it comes with unwanted software
Core Temp is safe, but you must uncheck “Install Goodgame Empire” during installation. It’s preselected and hidden under the icons section. I’ve installed Core Temp dozens of times – just watch for that checkbox and you’ll be fine.
Which temperature monitoring tool uses the least system resources?
Core Temp is the lightest option. It only monitors CPU temperature and uses minimal RAM and CPU power. If you want comprehensive monitoring, HWiNFO uses more resources but still runs efficiently on most systems.
")

